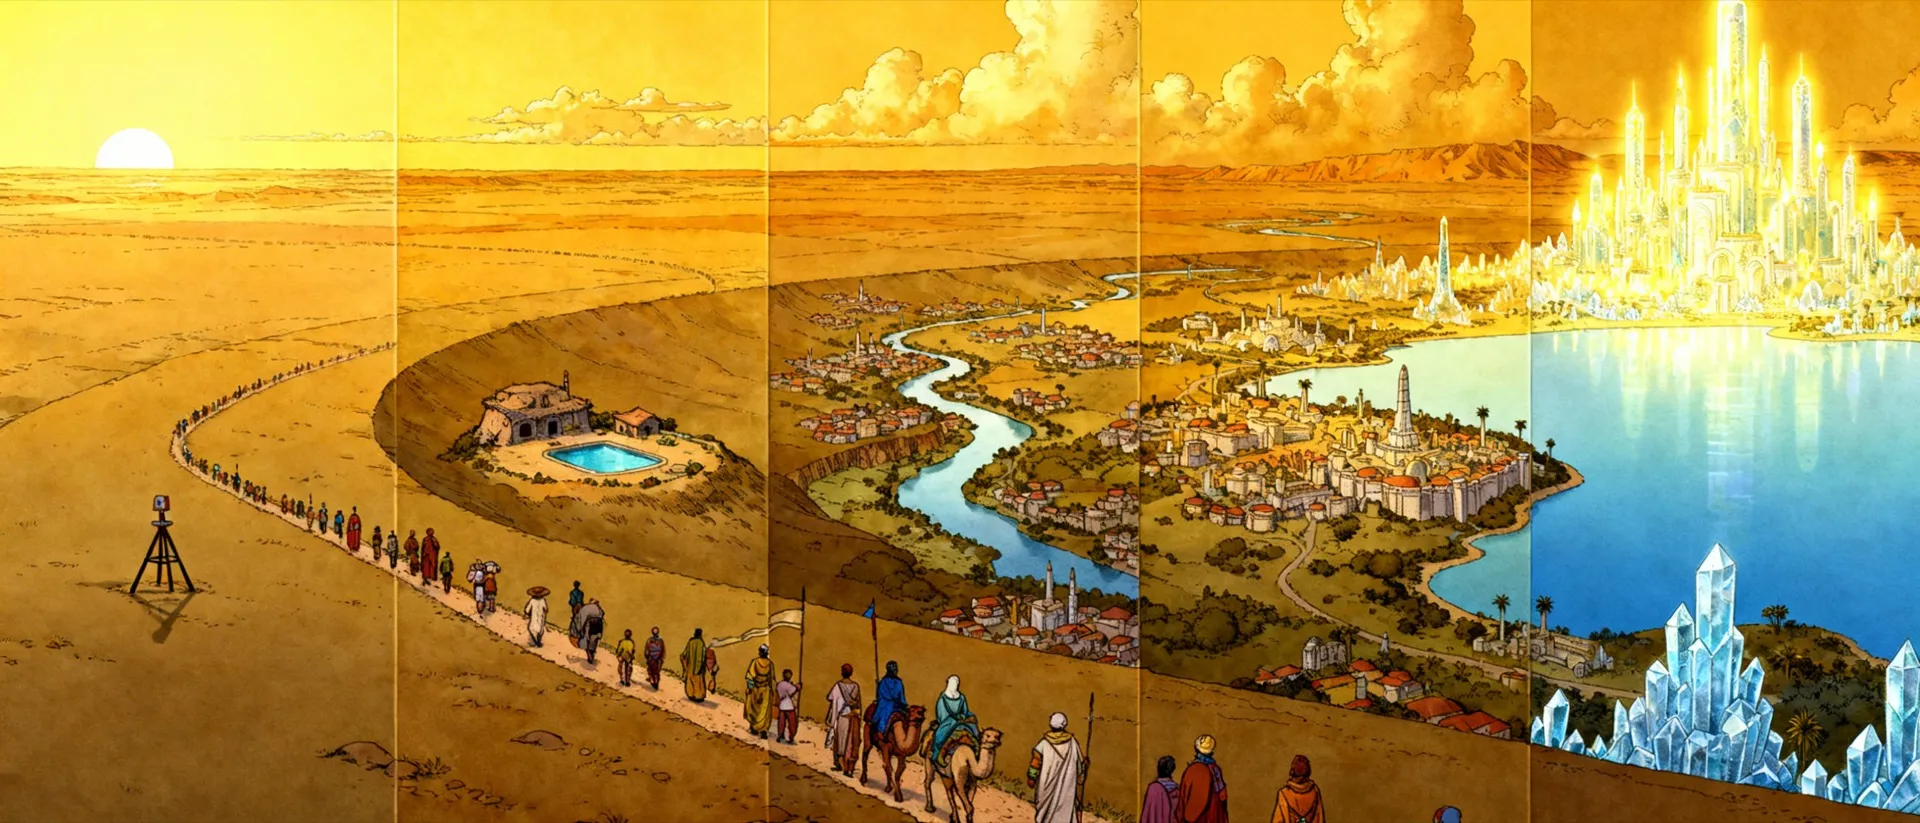
Crystal Lake

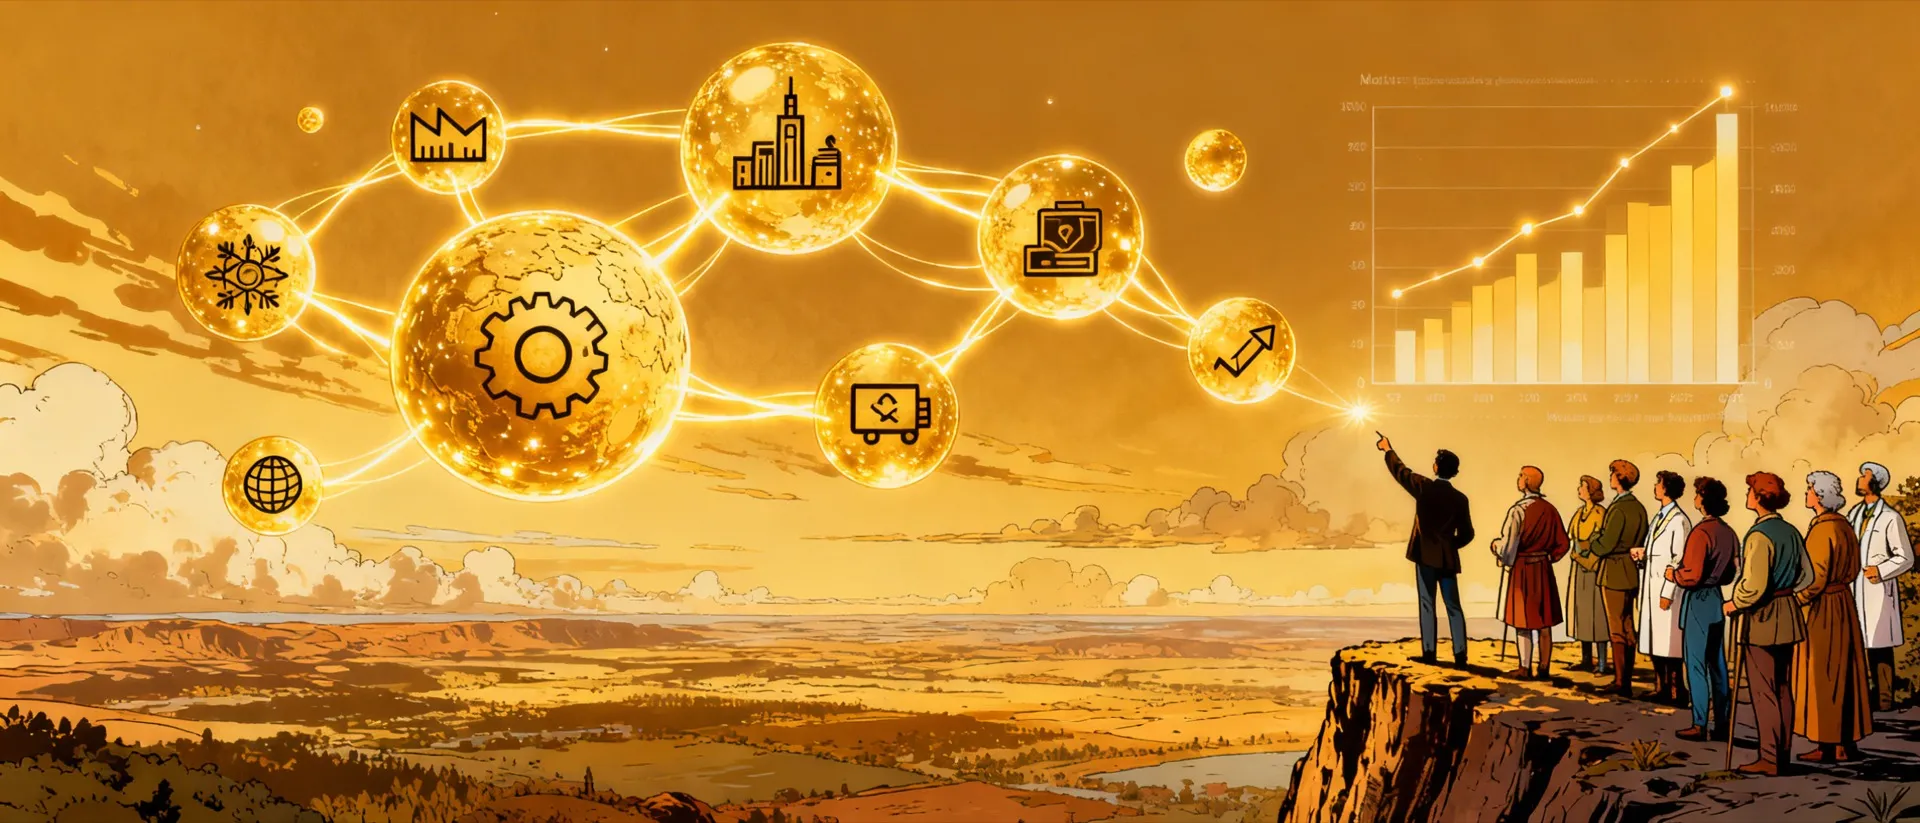
The Unified Market Intelligence Layer
Where all the streams converge.
Every ARK company contributes its unique market touchpoints — purchasing signals, behavioral data, competitive intelligence, demand patterns — into a single, crystal-clear view of the entire market landscape.
Every Touchpoint · Every Industry · One Lake
by Ark Singularity

Why a Crystal Lake Changes Everything

Each ARK company sees its own slice of the market. Together, they see everything.
From Silos to Shared Intelligence

The Problem with Silos

Every company in a portfolio generates market intelligence as a byproduct of doing business. A fashion brand sees purchasing trends. A logistics company sees supply chain flow. A fintech sees transaction patterns. But this intelligence stays trapped inside each company, invisible to the rest of the ecosystem.

The Crystal Lake Thesis

When every ARK company feeds its unique market touchpoints into a shared intelligence layer, the result is complete market visibility. Not just what one company sees — but the full picture: demand signals, purchasing intents, behavioral patterns, competitive movements, and emerging trends across every industry the ARK touches.

Demand
What markets want: trends, volumes, price sensitivity, seasonal patterns
Behavior
How markets act: buying cycles, decision patterns, churn triggers, loyalty drivers
Intent
Where markets are heading: search signals, pipeline velocity, emerging categories
Supply
What markets offer: capacity, pricing, lead times, quality benchmarks

The Touchpoints Each Company Contributes

Every business interaction generates market intelligence. These are the data streams that flow into Crystal Lake.
Market Touchpoints
01

Transaction Data

Every sale, purchase order, invoice, and payment reveals pricing dynamics, volume trends, and market willingness to pay

02

Customer Interactions

Support tickets, feature requests, onboarding patterns, and churn events map out what the market values and where friction exists

03

Pipeline & Funnel Data

Lead sources, conversion rates, deal velocity, and lost-deal reasons reveal purchasing intent and competitive positioning

04

Supply Chain Signals

Supplier quotes, lead times, capacity constraints, and logistics costs map the production side of the market equation

05

Product Usage Analytics

Feature adoption, engagement metrics, usage frequency, and workflow patterns show what the market actually does vs. what it says

06

Market Positioning Data

Pricing strategies, competitive wins/losses, market share movements, and category definitions reveal the competitive landscape

How ARK Companies Feed the Lake

Each company in the ARK ecosystem has unique access to market data through its particular industry and business model
ARK Companies Contributing Data
Fashion & Retail

Consumer Demand Lens

Seasonal purchasing cycles, trend velocity, price elasticity at retail, supplier negotiation dynamics, and cross-regional demand patterns.

Technology & SaaS

Digital Behavior Lens

Feature adoption curves, user engagement patterns, conversion funnels, churn predictors, and product-market fit signals at scale.

Logistics & Operations

Supply Flow Lens

Shipping volumes, route optimization data, warehouse throughput, delivery time patterns, and real-time capacity utilization across networks.

Financial Services

Transaction Flow Lens

Payment volumes, credit patterns, risk assessment data, investment flows, and economic indicators derived from real transaction activity.

Professional Services

Market Advisory Lens

Client problem patterns, industry challenge frequencies, engagement scopes, and the questions markets are asking before they act.

Real Estate & Infrastructure

Physical Market Lens

Location demand signals, occupancy patterns, development pipeline data, rent/price trends, and geographic expansion indicators.

The Crystal Lake Ingestion Pipeline

7 stages from raw company data to unified market intelligence
Ingestion Pipeline
01

Collect

Each ARK company exports its market-facing data through standardized connectors.

02

Anonymize

Strip proprietary identifiers. Preserve patterns, remove specifics. Privacy by design.

03

Normalize

Map industry-specific terms to universal market concepts. Unify schemas.

04

Enrich

Cross-reference signals across companies. What one sees partially, another completes.

05

Correlate

Find patterns across industries. Retail demand predicts logistics volume predicts financial flow.

06

Model

Build predictive market models from correlated multi-industry data streams.

07

Distribute

Feed insights back to each company as actionable intelligence for their specific context.

The 5 Intelligence Flows

Data streams that converge into Crystal Lake, each revealing a different dimension of the market
Five Intelligence Flows

Commerce Flow

Revenue Signals

Transaction volumes, average deal sizes, payment timing, and pricing acceptance across markets.

Engagement Flow

Behavior Signals

User activity patterns, retention curves, feature adoption, and the behavioral fingerprint of market segments.

Demand Flow

Intent Signals

Search patterns, pipeline creation velocity, RFP frequency, and the leading indicators of market appetite.

Supply Flow

Capacity Signals

Supplier response times, capacity utilization, cost fluctuations, and the operational pulse of supply networks.

Competitive Flow

Market Position Signals

Win/loss ratios, competitive displacement patterns, market share shifts, and positioning effectiveness.

Market Signal Types

The atomic units of intelligence that Crystal Lake captures, enriches, and distributes
Market Signal Types

Price Signals

Live

Real-time pricing from transactions, quotes, and negotiations across ARK companies.

Volume Signals

Live

Order volumes, shipping quantities, user counts — the pulse of market activity.

Timing Signals

Live

Seasonal patterns, purchase cycles, decision timelines, and urgency indicators.

Preference Signals

Enriched

Feature choices, product mix selections, brand affinities, and quality tier preferences.

Friction Signals

Enriched

Drop-off points, complaint patterns, return reasons, and dissatisfaction markers.

Growth Signals

Enriched

Expansion indicators, new market entries, category creation, and whitespace identification.

Risk Signals

Derived

Supply chain vulnerabilities, market concentration risks, regulatory exposure, and dependency mapping.

Opportunity Signals

Derived

Unmet demand patterns, underserved segments, arbitrage windows, and timing advantages.

Cross-Industry Intelligence

When data flows across industries, patterns emerge that no single company could see alone
Cross-Industry Intelligence

Retail → Logistics

Demand predicts capacity needs
Retail purchasing patterns signal logistics volume 30-60 days ahead. Pre-season orders predict warehouse demand. Return rates forecast reverse logistics capacity.
Retail sales velocity = leading indicator for logistics planning

SaaS → Finance

Usage predicts revenue
Product adoption curves predict subscription renewals. Feature usage patterns forecast expansion revenue. Churn signals predict cash flow gaps.
Engagement metrics = leading indicator for financial forecasting

Real Estate → Retail

Location predicts demand
Occupancy trends predict foot traffic. New developments signal market expansion. Rent trends reveal market health and purchasing power in regions.
Property absorption rate = leading indicator for retail expansion

Finance → All

Transactions reveal truth
Payment velocity across industries reveals economic health. Credit patterns predict B2B buying power. Investment flows signal where markets are heading next.
Transaction flow patterns = economic health indicator for all sectors

Services → SaaS

Problems predict products
Consulting engagement patterns reveal pain points at scale. Recurring advisory themes signal product opportunities. Implementation challenges predict feature priorities.
Advisory request patterns = product roadmap intelligence

Logistics → Manufacturing

Movement predicts production
Shipping route optimization reveals regional demand shifts. Warehouse throughput predicts factory output requirements. Delivery patterns reveal end-consumer geography.
Distribution patterns = production planning intelligence

The Crystal Lake Data Schema

A unified schema that maps market signals regardless of which industry generated them
Crystal Lake Data Schema

Signal Entities

Market — Industries, segments, geographies, verticals
Actor — Buyers, sellers, intermediaries, influencers
Product — Goods, services, subscriptions, bundles
Transaction — Sales, purchases, renewals, cancellations
Signal — Demand, intent, friction, opportunity indicators
Channel — Direct, partner, digital, physical touchpoints
Trend — Emerging, growing, plateauing, declining patterns
Benchmark — Industry averages, percentiles, thresholds
Prediction — Forecasts, projections, confidence intervals

Relationship Types

generates — Actor generates Transaction
signals — Transaction signals Trend
predicts — Trend predicts Demand
competes — Product competes Product
serves — Channel serves Market
benchmarks — Transaction benchmarks Market
correlates — Signal correlates Signal
precedes — Signal precedes Transaction
influences — Trend influences Market
validates — Benchmark validates Prediction
enriches — Signal enriches Actor
disrupts — Trend disrupts Market

The Crystal Lake Transformation

What changes when every ARK company shares its market view
Before and After Crystal Lake

Without Crystal Lake

Each company sees only its own customers
Market intelligence is anecdotal and slow
Competitive insights come from expensive third-party reports
Cross-selling relies on guesswork and manual introductions
Trends are spotted after they peak
Pricing is set by gut feel and competitor copying
New market entry is a leap of faith
vs

With Crystal Lake

Every company benefits from the entire ARK’s market reach
Market intelligence is data-driven and real-time
Competitive insights emerge from actual transaction patterns
Cross-selling is driven by correlated demand signals
Trends are detected as they form, not after they crest
Pricing is informed by cross-industry market data
New market entry is backed by multi-source validation

The 4-Layer Intelligence Stack

Raw data becomes actionable intelligence through progressive refinement
L1

Collection

Raw touchpoint data from every ARK company. Transactions, interactions, usage metrics, supply chain events. The foundation — data in its native form.

L2

Enrichment

Cross-referencing signals across companies. When a retail signal meets a logistics signal meets a financial signal, the picture becomes three-dimensional.

L3

Intelligence

Pattern recognition at scale. Predictive models that identify trends before they’re obvious. “This demand signal in fashion predicts a logistics capacity need in 45 days.”

L4

Action

Insights distributed back to each company as specific, contextualized recommendations. Not generic reports — targeted intelligence each company can act on immediately.

Implementation Roadmap

From first streams to full market intelligence
Implementation Roadmap

Phase 1

Foundation

Embark-powered ontologies for each ARK company. Standardized data schemas. First cross-company signal mapping.

Phase 2

Streams

Automated data connectors for 3-5 ARK companies. Anonymization pipeline. First cross-industry correlations.

Phase 3

Intelligence

Predictive models from correlated data. Cross-industry trend detection. Actionable insight distribution to each company.

Phase 4

Scale

Full ARK ecosystem connected. Real-time signal processing. Industry benchmark generation. External data enrichment.

Phase 5

Vision

Market intelligence as a service. Anonymized industry insights beyond ARK. The definitive source of cross-market truth.

Crystal Lake Vision Ark Singularity

One Lake. Every Stream.
Complete Market Clarity.

Crystal Lake transforms the ARK from a collection of companies into a market intelligence network. Each company contributes what it sees. Every company benefits from what all see together. The result is a shared, living map of market reality that no single company could build alone.
Where All Streams Converge